Table information for 'rome.images'
General
This table is
available for
ADQL queries and through the
TAP endpoint.
Resource Description:
The ROME/REA (Robotic Observations of Microlensing Events/Reactive
Event Assessment) Survey was a Key Project at Las Cumbres Observatory
(hereafter LCO) which continuously monitored 20 selected fields (3.76
sq.deg.) in the Galactic Bulge throughout their seasonal visibility
window over a three-year period, between March 2017 and March 2020.
Observations were made in three optical passbands (SDSS g', r', i'),
and LCO's multi-site telescope network enabled the survey to achieve a
typical cadence of ~10hrs in i' and ~15hrs in g' and r'. In
addition, intervals of higher cadence (<1hr) data were obtained during
monitoring of key microlensing events within the fields. This
catalog includes the full timeseries photometry for all ~8 million
stars, down to a limiting magnitude of i~18mag.
For a list of all services and tables belonging
to this table's
resource, see Information on resource 'ROME/REA Timeseries Photometry Data Release 1'
Resource Reference URL:
Resource info
Citing this table
To cite the table as such, we suggest the following
BibTeX entry:
@MISC{vo:rome_images,
  year=2024,
  title={{ROME}/{REA} Timeseries Photometry Data Release 1},
  author={Street, R.A. and Bachelet, E. and Tsapras, Y. and Hundertmark, M.P.G. and Bozza, V. and Bramich, D.M. and Cassan, A. and Dominik, M. and Figuera Jaimes, R. and Horne, K. and Mao, S. and Saha, A. and Wambsganss, J. and Zang, W.},
  url={http://dc.g-vo.org/tableinfo/rome.images},
  howpublished={{VO} resource provided by the {GAVO} Data Center}
}
Copyright, License, Acknowledgements
Resource Documentation
As a short example for how to explore this data using VO protocols,
try this:
Open TOPCAT and it's VO/TAP window. Select "GAVO DC TAP" from
the server selection and hit "use service".
We would like to find "unusual" time series; perhaps ones with
a large range. To get a feeling for what "unusual" might mean,
just fetch a few metadata rows like with a TAP query like this:
SELECT TOP 7000 * FROM rome.time_series
WHERE np_i>100 AND np_g>100
Do a plane plot of that data, and ask TOPCAT to plot
mag_i_max-mag_i_min against mag_g_max-mag_g_min.
When you open a table view, you can inspect the metadata
for the time series when clicking on a point in the plot.
Let's inspect the actual data: In TOPCAT's main window,
do Views/Activation Actions. If you check "Plot Table",
TOPCAT will download and plot the time series; it will only
plot the first lightcurve, though. To get all bands, at this point you
have to manually fetch accref from the table and use File -> Load Table.
Sorry about this.
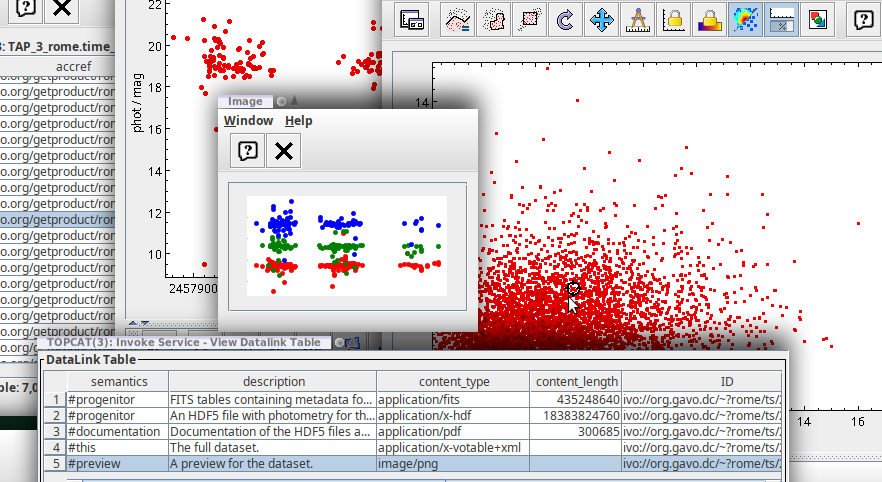
Using datalink, you can also view three-band previews with one click on
a plot point. To configure this, check "Invoke Service" in the
Activation Actions, then use "Invoke now". In the dialog that
pops up then, select the row with #preview and check Auto-Invoke.
You will then see a light rendition of the light curves in (up to)
three colours.
Your desktop could then look somewhat like this:
Columns
Sorted alphabetically. [Sort by DB column index]
| Name | Table Head |
Description | Unit | UCD |
|---|
| accref |
Product key |
Access key for the data
|
N/A |
meta.ref.url |
| accsize |
File size |
Size of the data in bytes
|
byte |
VOX:Image_FileSize |
| airmass |
Airmass |
Airmass for this observation
|
N/A |
obs.airMass |
| dataset_code |
Dataset Id |
Dataset this image belongs to (a dataset in ROME/REA is the collection of all images from a given instrument)
|
N/A |
N/A |
| embargo |
Embargo ends |
Date the data will become/became public
|
yr |
N/A |
| exposure |
Exposure |
Exposure time for this image
|
s |
time.duration;obs.exposure |
| field |
Field |
ROME field the object was observed in
|
N/A |
meta.id;obs.field |
| filename |
File Name |
Upstream file name for this image
|
N/A |
N/A |
| filter |
Filter |
Filter this image was taken with
|
N/A |
meta.id;instr.filter |
| frac_sat_pix |
|Sat|/pix |
Fraction of saturated pixels on this image
|
N/A |
phot.count;arith.ratio |
| hjd |
Hjd |
HJD (i.e., UTC with light-time corrections for the solar centre) of the midpoint of exposure
|
d |
time.epoch |
| image_index |
Image_index |
Internal index of the image within a dataset, starting from 0. This correspondds to the index of a photometry row in the photometry hdf5s
|
N/A |
meta.id |
| mime |
Type |
MIME type of the file served
|
N/A |
meta.code.mime |
| moon_ang_separation |
Moon dist. |
Angular Distance to the moon
|
deg |
instr.param;pos.angDistance |
| moon_fraction |
Moon_fraction |
Moon phase, 0=new moon
|
N/A |
instr.param |
| nstars |
N |
Number of photometry points extracted from this image
|
N/A |
meta.number |
| owner |
Owner |
Owner of the data
|
N/A |
N/A |
| qc_flag |
Flags |
Quality flags; null means a good image, for other codes see table note
[Note q]
|
N/A |
meta.code.qual |
| rome_id |
Image Id |
Identifier for the ROME/REA image. This is field*100000+per-field-index
|
N/A |
meta.id;meta.main |
Columns that are parts of indices are marked
like this.
Other
The following services may use the data contained in this
table:
VOResource
VO nerds may sometimes need
VOResource XML for this table.
Notes
Note qqc_flag is a bitmap, where 0 means a good image. In the light curves
we serve, only points with qc_flag=0 are retained, and you should only
use other data if you really know what you are doing. In case you
get ROME data from other sources, here is what the flags mean:
| 1 |
No valid photometric measurement possible by stage 6 |
| 2 |
Image photometry displayed excessive scatter (mostly bad seeing) |
| 4 |
Data point failed phot scale factor/exposure time metric |
| 8 |
Low quality image resampling |
| 16 |
Difference image exhibited high residuals |
![[CC-BY-SA]](/static/img/ccbysa.png)