Table information for 'xpparams2.covs'
General
Table Description:
A table of covariances (as upper triangle
matrices) for the stellar parameters in xpparams2.main). This is
intended for use as in:
SELECT ..., cov_triu
FROM xpparams2.main NATURAL JOIN xpparams2.covs
WHERE ...
If you only need particular elements of the covariance matrix,
you can subscript cov_triu, perhaps as in
cov_triu[4] AS teff_xi_cov.
This table is
available for
ADQL queries and through the
TAP endpoint.
Resource Description:
We measure the extinction curves of 220 million stars with Gaia XP spectra
and near-infrared photometry from 2MASS and WISE. We use a data-driven
model that is developed from 2023MNRAS.524.1855Z, with variable
extinction curves, to determine stellar parameters and extinction curves
simultaneously.
For bulk downloads and the trained model, see
https://doi.org/10.5281/zenodo.10719756.
For a list of all services and tables belonging
to this table's
resource, see Information on resource 'Three-dimensional maps of the interstellar dust extinction curve
within the Milky Way galaxy'
Resource Reference URL:
Resource info
Citing this table
To cite the table as such, we suggest the following
BibTeX entry:
@MISC{vo:xpparams2_covs,
  year=2025,
  title={Three-dimensional maps of the interstellar dust extinction curve
within the Milky Way galaxy},
  author={Zhang, X. and Green, G.},
  url={http://dc.g-vo.org/tableinfo/xpparams2.covs},
  howpublished={{VO} resource provided by the {GAVO} Data Center}
}
Resource Documentation
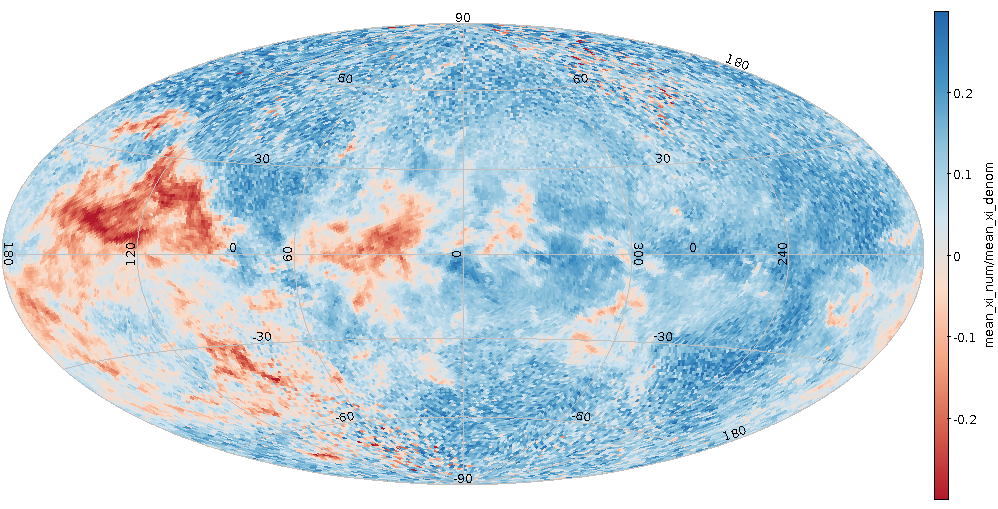
Example: A Dust Map
As an example of what one can do with this data, consider the following
ADQL query to generate an all-sky maps of the mean extinction and means of
ξ and R(55) for stars at a distance between 400 pc and 600 pc:
SELECT
        source_id/140737488355328 AS hpx,
        avg(ext/(err_ext*err_ext+0.0001)) AS mean_ext_num,
        avg(1/(err_ext*err_ext+0.0001)) AS mean_ext_denom,
        avg(xi/(err_xi*err_xi+0.0001)) as mean_xi_num,
        avg(1/(err_xi*err_xi+0.0001)) as mean_xi_denom,
        avg(r55*r55*r55/(err_r55*err_r55+0.0001)) as mean_inv_r55_num,
        avg(r55*r55*r55*r55/(err_r55*err_r55+0.0001)) as mean_inv_r55_denom
FROM xpparams2.main
WHERE
        mod_parallax BETWEEN 1.67 and 2.5
        AND quality_flags < 8
        AND mod_parallax/err_mod_parallax > 5
        AND err_ext < 0.5
GROUP BY hpx
This exploits the fact that Gaia source ids can be converted to
HEALPixes to produce a map and shows how to do useful quality cuts
that allow relatively careless use of the data. Note that we
calculate means weighted by the inverse variance for robustness.
If you use TOPCAT to execute this on the GAVO DC TAP service (select
Asynchronous mode and make sure you set Max Rows to something more than
50000, because that is how many pixels our map will have), you can
do a sphere plot, then add a Healpix control. In it, select the table
resulting from this query, manually set the HEALPix level to 6 and
configure the Axis to Aitoff projection in the Galactic system to
arrive such a plot of mean_ext_num/mean_ext_denom:

With this data, you can also get an idea of what sort of dust there is via
the R(55) (or, if you prefer, ξ) parameter. Because 1/R(55) is better
behaved than R(55) (as the extinction curve flattens and then tilts
slightly blueward, the parameter R(55) first goes to infinity and then
discontinuously jumps to negative infinity), we calculate the
inverse-variance-weighted mean of 1/R(55). Below are plots of ξ (top) and
R(55) (calculated by inverting the 1/R(55) map):
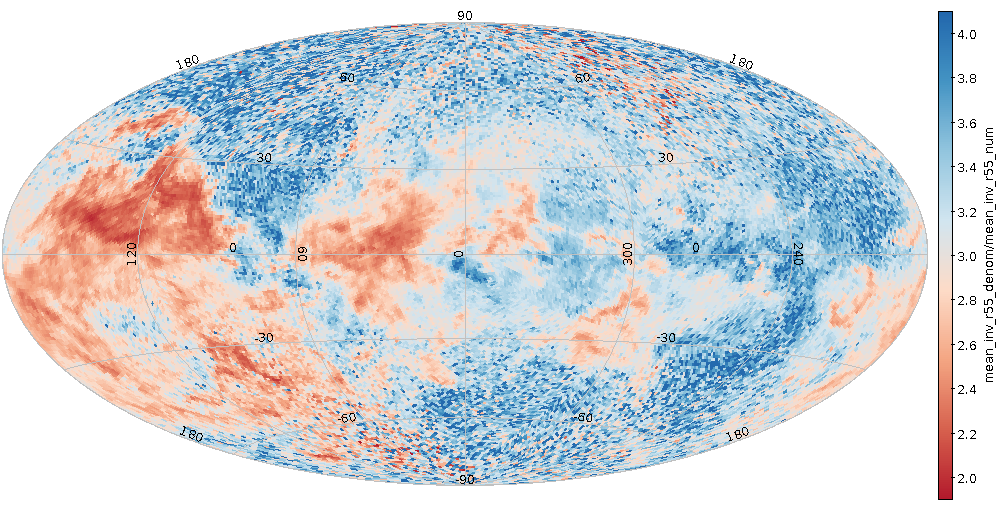
Note that in regions of low extinction, the measurements of ξ (and
consequently R(55)) are noisy, and should be treated with caution.
Columns
Sorted by DB column index. [Sort alphabetically]
| Name | Table Head |
Description | Unit | UCD |
|---|
| source_id |
Source Id |
Gaia DR3 unique source identifier. You can match this against gaia.dr3lite on this TAP service.
|
N/A |
meta.id;meta.main |
| triu |
Cov |
Upper triangle of the covariance matrix of the stellar parameters from xpparams2.main. The variables are, in sequence: T_eff, [Fe/H], logg, ξ, E, and parallax.
|
N/A |
stat.covariance |
Columns that are parts of indices are marked
like this.
Other
The following services may use the data contained in this
table:
VOResource
VO nerds may sometimes need
VOResource XML for this table.